A lot of questions that usually don't have enough answers.
There are many well know ways your application can leak memory. To name a few
- static references to Contexts, Views or Activities
- inner classes holding a reference to the outer class
- anonymous classes, commonly used in listeners
- drawables holding a reference to the Context
- and many more cases
If you are interested in more detailed descriptions of these common ways your app can leak memory this article will help you.
Also, as there are pitfalls there are tools to help you find them. Again, to name a few
- Android Studio monitors
- dalvik and art GC log messages
- heap dumps
- dumpsys
- etc.
To do an effective use of these tools and uncover memory leaks you should stress your app, running it for a while, or forcing continuous invocations of Activities, perhaps navigation back to the Home screen and launching the Activity again and again. While you can do this manually and the most obvious cases will be detected, it is always more efficient to automate these steps so they can be run before and after to verify that you actually solved the problem.
And what better than AndroidViewClient/culebra to automate these steps as we have discussed so many times in previous articles. Precisely, one of the latest additions is the ability to capture dumpsys information and create plots with it.
This is an example of a method we can define to exercise our Activities including some extra steps like stopping the application to start clean and forcing garbage collection along the way (see complete source code here)
def __plot_dumpsys_meminfo(self, pkg, activity, method=None):
    self.device.shell("am force-stop %s" % pkg)
    for n in range(20):
        if n % 5 == 0:
            self.device.shell(
                "run-as %s pgrep -L 10 %s" % (pkg, pkg))
        self.device.startActivity("%s/%s" % (pkg, activity))
        time.sleep(2)
        if method:
            method()
        self.plot.append(Dumpsys(self.device, Dumpsys.MEMINFO, pkg))
        self.device.press('BACK')
        time.sleep(0.5)
        self.device.press('BACK')
        time.sleep(0.5)
        self.device.press('HOME')
        time.sleep(0.5)
    self.plot.plot()
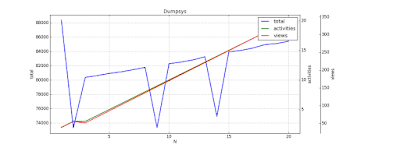
With every iteration, we are collecting the dumpsys meminfo for the process, exiting the app by sending BACK and returning to Home, and at the end, we plot the chart.
We can easily see that while we are forcing GC the amount of memory used, the number of Activities and Views are constantly increasing.
As always, you can find more information about AndroidViewClient/culebra in its wiki at https://github.com/dtmilano/AndroidViewClient/wiki, about CulebraTester at http://culebra.dtmilano.com/ and https://github.com/dtmilano/CulebraTester-public/wiki and if you have any question you can ask in Stackoverflow using http://stackoverflow.com/questions/tagged/androidviewclient.
Hope this help you spot some leaks in your app.
